Thought of the Week - Why the long face?
A horse walks into a bar and asks the bartender... Okay, this post is not about lame jokes, but about trying to forecast stock markets with the help of facial recognition.

A duo from Strathclyde University thought they could use facial expressions in stock market videos to analyse market sentiment. Intuitively, this may work because we famously convey more information nonverbally through gestures and facial expressions than through language. So, instead of creating a market sentiment indicator from written news reports, as others have done, why not look at faces?
To do this, the researchers trained a machine-learning programme to analyse the facial expressions of videos on the US stock market uploaded on the Financial Times website. They then created a simple sentiment indicator that measured the percentage of negative facial expressions the machine recognised in the videos
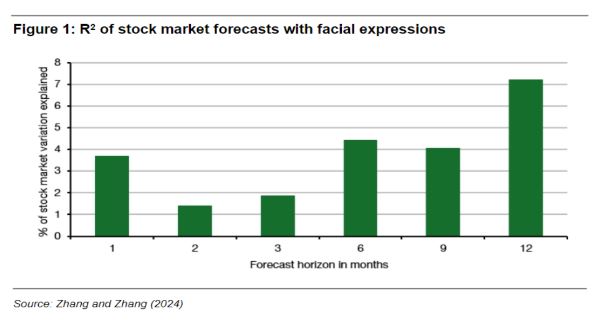
Indeed, they could prove that this facial expression sentiment indicator (FESI) manages to forecast future excess return over cash for the S&P 500. The resulting R2 for different forecast horizons is shown below.
Looks great as long as you ignore the vertical axis. Remember that the R2measures the percentage of the variation in returns that can be explained by the forecast (at least for univariate regressions like this one). So, their sentiment indicator can explain a whopping 3.7% of the variation in the S&P 500 in the following month. Call every macro hedge fund and tell them you want a job...
Indeed, their research is silent about the outperformance created with this FESI forecast, but my guess is it is negligible after transaction costs. Indeed, they try to show that their FESI is better than other forecast variables over a forecast horizon of one month.
But who cares about the forecast one month ahead? Plus, they compare their FESI with other forecasting variables like the valuation of the S&P 500, the term spread of the Treasury market, the current inflation rate, and the current unemployment rate. And while their FESI is better than all of these, it barely beats the current inflation rate in forecasting S&P 500 returns.
Who in his right mind uses the inflation rate to forecast the stock market in the coming month? Besides, inflation rates are published weeks after the month is over, but I didn’t bother to check if they accounted for that reporting delay. In the end, this is, in my view, an example of research that shows just one thing: It’s very hard to read faces, especially for a machine.
Thought of the Day features investment-related and economics-related musings that don’t necessarily have anything to do with current markets. They are designed to take a step back and think about the world a little bit differently. Feel free to share these thoughts with your colleagues whenever you find them interesting. If you have colleagues who would like to receive this publication please ask them to send an email to joachim.klement@panmureliberum.com. This publication is free for everyone.

